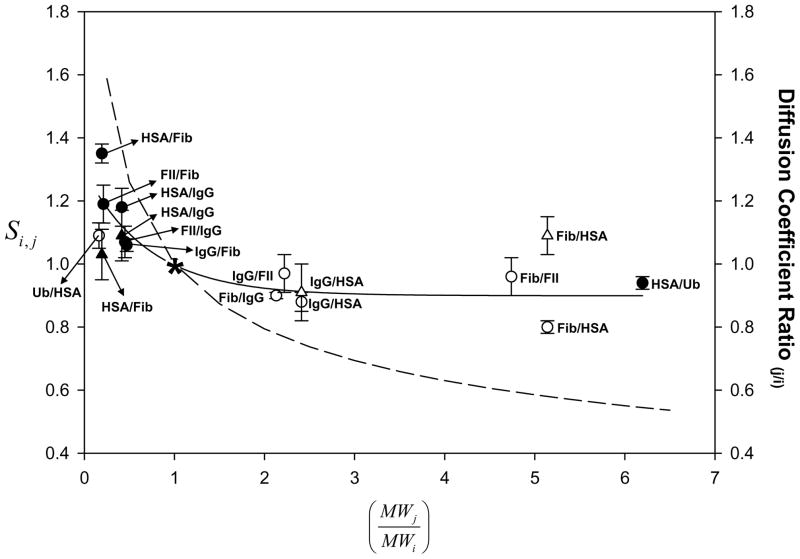
Figure 3.
Curvilinear relationship between the adsorption selectivity factor Si,j (left ordinate, see also Fig. 2) and molecular-weight ratio for i and j proteins in adsorption competition for the same hydrophobic adsorbent from stagnant binary-protein solutions (open and closed circles = octyl sepharose OS; open and closed triangles = silanized glass OTS). Star data point represents the hypothetical competition between two identical proteins (i = j for which ). Open symbols correspond to Si,j and closed symbols correspond to the reversed-selectivity factor S̄i,j (see Sections 3.2.2 and 4.1.2). Solid line through the data is a guide to the eye. Dashed line (right ordinate) is the ratio of diffusion-coefficients calculated from the Stokes-Einstein-Sutherland equation for two dissimilar-sized proteins with radius scaling as MW1/3 (see Section 4.1.2). Similarity in trends and magnitude between experiment and theory suggests that adsorption selectivity could arise from a difference in protein diffusion rates that preferentially fills the surface region with smaller proteins.

