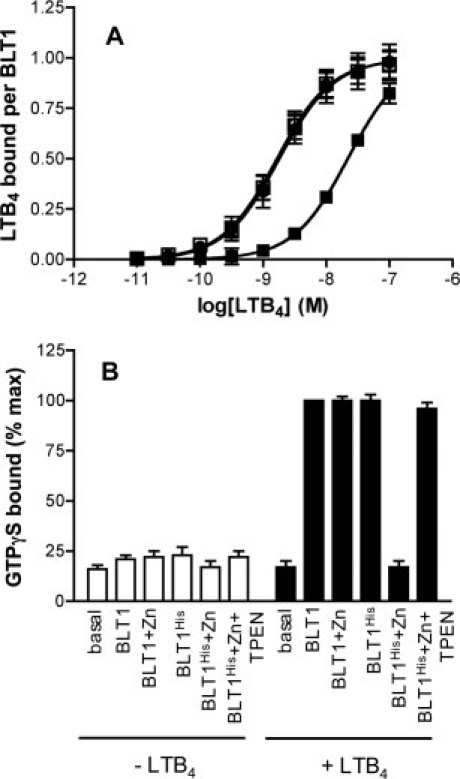
Figure 3.

Agonist binding and receptor-catalyzed G protein activation. A: LTB4-binding to BLT1 (circles) or BLT1His (squares) in the absence (open symbols) or the presence (closed symbols) of 1 mM Zn2+. The binding data are presented as a plot of the amount of LTB4 bound per BLT1 receptor as a function of LTB4 concentration. B: GDP/GTP exchange on Gαi catalyzed by BLT1 or BLT1His in the absence of Zn2+ (BLT1 and BLT1His), in the presence of 1 mM Zn2+ (BLT1 + Zn and BLT1His + Zn), or on successive addition of 1 mM Zn2+ and then 1 mM TPEN (BLT1His + Zn + TPEN), and in the absence (−LTB4) or the presence of 25 μM LTB4 (+LTB4). Data are expressed as the percent of maximal binding GTPγS obtained for the wild-type BLT1 receptor. In all cases, data represent the mean SE from three independent experiments.
