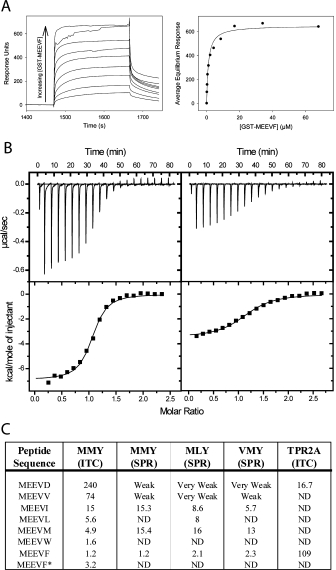
Figure 4.

Quantifying T-Mod-Peptide Binding Interactions. (A) Surface Plasmon Resonance (SPR). Left: Example of a titration curve showing sensorgrams as a function of fusion protein (GST-MEEVF) concentration, with T-Mod(MMY) immobilized on the chip. The sensorgrams have been corrected for nonspecific binding by subtraction of a channel without TPR bound. Right: Equilibrium response plotted versus concentration of GST-MEEVF. The solid line is a fit of the data to a 1:1 binding model. This fit gives a dissociation constant (Kd) of 1.2 μM. (B) Isothermal titration calorimetry (ITC). T-Mod(MMY) was titrated into GST-MEEVF (left) and GST-MEEVM (right). The heats were integrated and fit to a 1:1 binding model. For GST-MEEVF, Kd = 1.2 μM and stoichiometry (N) = 1.03. For GST-MEEVM, Kd = 4.1 μM and N = 1.15. (C) Dissociation constants (μM) of different TPR-peptide interactions. All measurements were made with TPRs and GST-peptide fusions except for MEEVF*, where the 5-mer peptide was used. ND indicates measurement was not determined. When interactions were measured in duplicate, average values are shown, and for these measurements the reported values have an error of ±25% between complete duplicate experiments.
