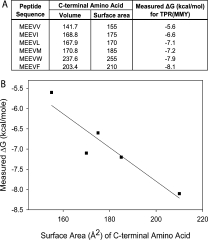
Figure 5.

Correlation Between C-terminal Amino Acid Identity and Free Energy. (A) Free energy of binding (ΔG) measured using ITC for the series of GST-peptide fusions with T-Mod(MMY). These values are directly correlated with the surface area11 and volume10 of the C-terminal amino acid. (B) Plot of the measured free energy of binding versus the surface area of the C-terminal amino acid of the peptide. The linear regression gives a slope of about 40 calories per Å2 and a correlation coefficient of 0.93.
