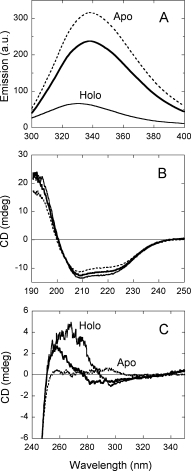
Figure 1.

Comparison of spectral properties of holoenzyme in the absence (holo-apo, –––) and in the presence (holo, –––) of 40 μM FAD, and apoprotein (- - - -) of hDAAO. (A) Protein fluorescence (excitation at 280 nm, 0.1 mg protein/mL). (B) Far-UV CD spectrum (0.1 mg protein/mL). (C) Near-UV CD spectrum (0.4 mg protein/mL). Proteins were in 50 mM potassium pyrophosphate, pH 8.0, 5% glycerol; measurements were performed at 15°C.
