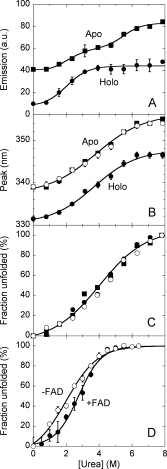
Figure 2.

Equilibrium denaturation curves of holoenzyme in the absence (open circles) and in the presence (filled circles) of 40 μM FAD and apoprotein (squares) of hDAAO as detected by using different techniques. (A,B) Tryptophan fluorescence (excitation at 280 nm, 0.02 mg protein/mL): the fraction of unfolded hDAAO was determined from the fluorescence intensity at ∼340 nm using the value for the untreated and 8M urea-treated proteins as reference, (A); position of the emission peak maximum, (B). (C) Far-UV CD measurements at 220 nm (proteins were 0.1 mg/mL). (D) Activity of hDAAO holoenzyme as a function of urea concentration following incubation with the denaturant for 60 min at 15°C. Lines represent the best fit obtained using a two-state denaturation model with the only exception of changes in fluorescence intensity for the apoprotein (panel A), for which a three-state model was used. The reported values have been corrected for readings prior to protein addition.
