
Figure 3.
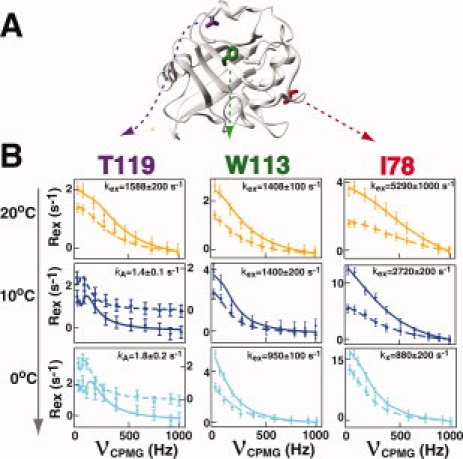
Several chemical exchange processes occur within free CypA. (A) The positions of three residues within CypA that exhibit different temperature dependencies are shown and include T119 (magenta), W113 (green), and I78 (red). (B) The R2-CPMG dispersion profiles are shown for these same residues at 20°C (orange), 10°C (dark blue), and 0°C (light blue) at both 600 MHz (dashed line, ▪) and 900 MHz (straight line, •). The extracted exchange rates, kex, are shown for each simultaneous fit of the data at both static magnetic fields. For T119 the axis for each field at 0°C and 10°C are offset for 600 MHz (right axis) for clarity since there is no static magnetic field dependence for this residue at these temperatures and their exchange is difficult to see when superimposed. [Color figure can be viewed in the online issue, which is available at www.interscience.wiley.com.]