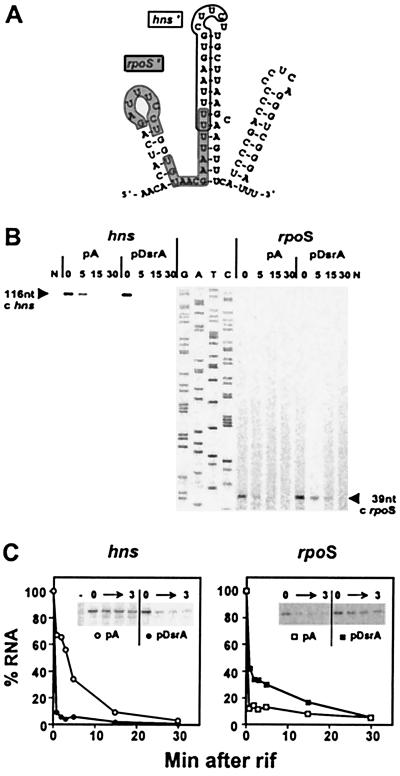
Figure 1.
Primer extension analysis to monitor RNA stability. (A) Computer-predicted structure of DsrA RNA (11). The rpoS-complementary region (rpoS′) is shown on a gray background; the hns-complementary region (hns′) is outlined (4). (B) Primer extension analysis of hns and rpoS mRNAs. RNA from cells containing a plasmid (pDsrA) was compared with a vector control (pA). Numbers indicate the time (min) after rifamycin addition (0 min). N, no-RNA control. A DNA sequencing ladder (G, A, T, C) was used as a mobility marker. (C) RNA stability plots. cDNA levels from primer extension analyses were quantified by PhosphorImager and plotted relative to the zero time point for each experiment. Each data point represents the average of two experiments. The decrease in hns mRNA half-life in the presence of excess DsrA is >8-fold. The increase in rpoS mRNA stability in the presence of excess DsrA is ≈3-fold. Gels inset into the graphs are primer extension analyses of 0–3 min time points.

