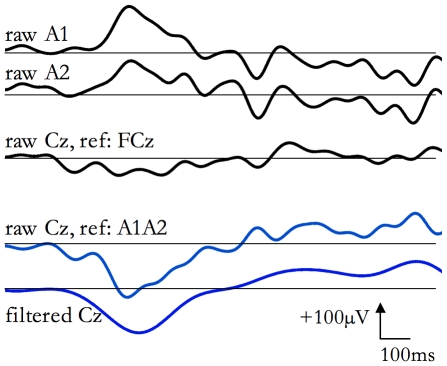
Figure 1. EEG re-referencing and filtering.
The same SSO is shown. The upper three traces are the raw EEG (the channels Cz, A1 and A2, all referenced to Fcz) signals. In the middle, Cz signal is shown after re-referencing to the average between the two earlobe potentials (A1 and A2). At the bottom, the re-referred Cz trace, band pass filtered in the range 0.1–4.4 Hz is plotted.

