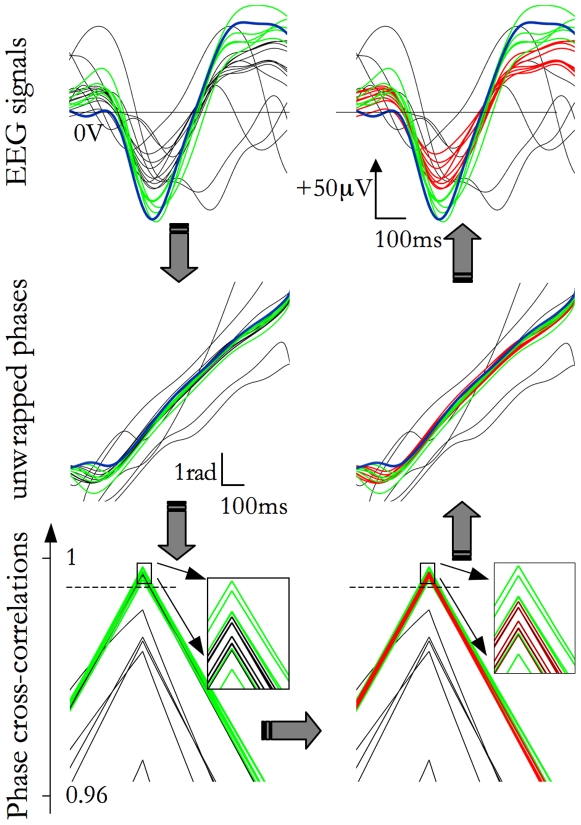
Figure 2. SSO event detection steps.
Signals are scanned and SSOs are detected applying the Detection Criteria. A branch of concurrent SSOs, grouped in a event, are shown in the top left panel (blue and green lines, throughout all panels, the same color code has been used for each type of waves). The thickest blue trace identifies the ‘prototype’ of the event, namely the first SSO according to the temporal occurrence of its negative peak. In the middle panel on the left, instantaneous phases of the signals are plotted. In the bottom panel on the left, the cross-correlations functions between the prototype and the other traces are plotted. Applying the Likeness Constraint (dashed horizontal line), some sub-threshold SSOs are selected (red traces, in the bottom right panel). In fact, in the time-phase plane (middle panel on the right) well expressed and sub-threshold SSOs are superimposed. Also sub-threshold SSO signals are very similar to concurrent well-expressed SSOs (upper, right panel).

