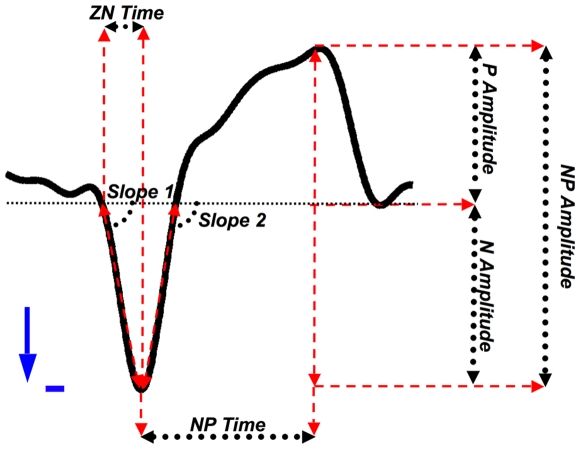
Figure 3. Graphical definition of the extracted morphological features.
Each detected wave was characterized by means of seven features: three amplitude measures (the negative peak to positive peak amplitude - NP amplitude -, the negative peak amplitude - N amplitude - and the positive peak amplitude - P amplitude), two steepness measures (the absolute value of the slopes of the signal between the first zero crossing and the negative peak - slope 1 - and between the negative peak and the second zero-crossing - slope 2), and two different estimation of temporal width (the negative peak to positive peak time - NP time - and the first zero crossing to negative peak time interval - ZN time).

