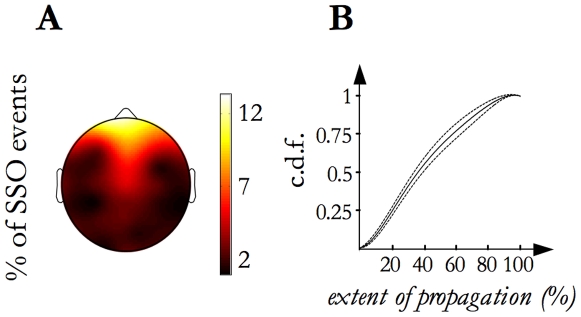
Figure 4. Origin location map and Extent of propagation distribution.
A) The grand mean of the origin density map calculated from the individual maps is shown. It illustrates the frequency (reported as percentage) of SSO event origin for each electrode site. B) The thickest line represents the average (among subjects) cumulative distribution function (c.d.f.) of the extent of propagation and the two thinner lines correspond to the inter-subject confidence interval (p = 0.95).

