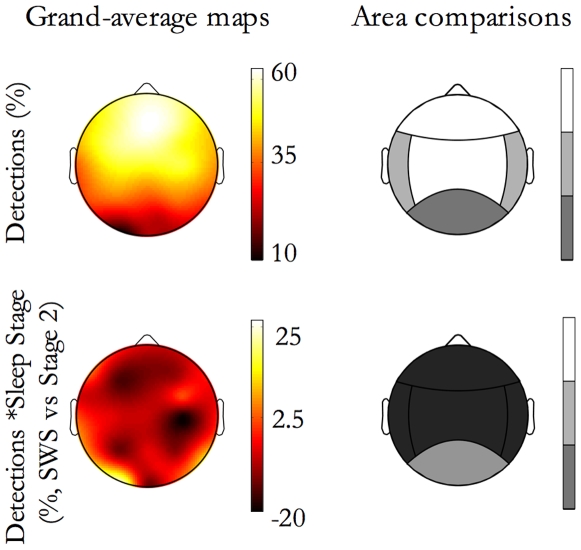
Figure 6. SSO detection location.
The extent of propagation in the area is shown as function of Detection Location and Sleep Stage. On the left of the first row, the map of detections (% of events affecting each electrode) is depicted; on the right the corresponding contrasts between areas for the Extent of propagation in the area are shown by a grayscale code. Each step in the grayscale indicates a significant difference (p<0.01) between contiguous tones. The grayscale is ordinal, namely lighter tones correspond to higher extent of propagation values. On the left of the second row, the difference between the detections in each stage (for each electrode, percentage of events in SWS minus same in stage 2) is depicted; on the right the corresponding contrasts between stages for the extent of propagation in the area are shown. The extent of propagation in the area is greater in NREM Sleep Stage 2 than SWS, except for SSOs detected in the posterior area. On the right column, a grayscale code indicates for each detection area if feature values are significant greater during SWS (white), or during sleep stage 2 (black) while grey indicates no difference between stages.

