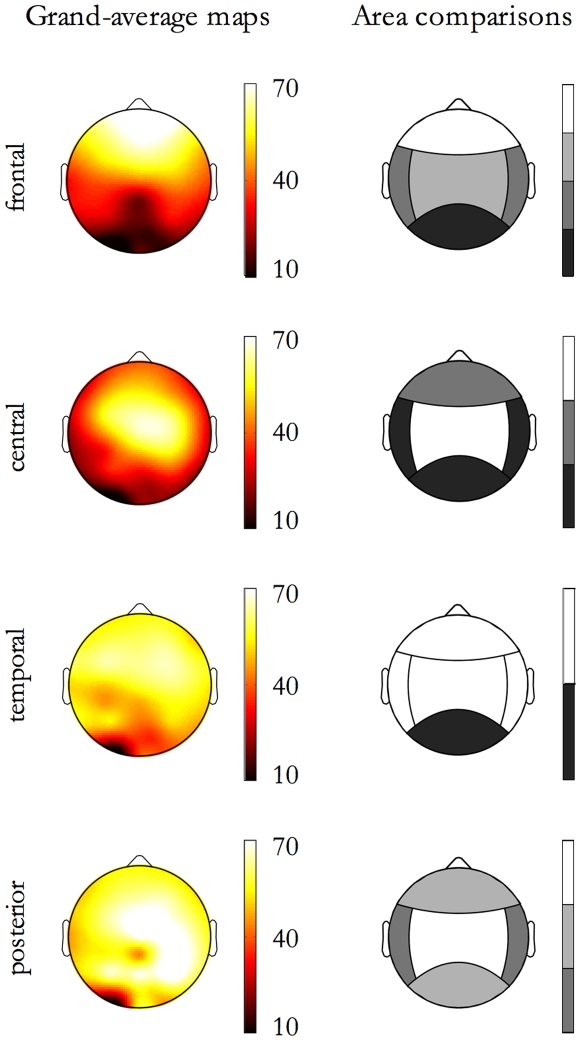
Figure 7. Extent of propagation in the area as function of Origin Location.
On each row, map related to events originating in an area are shown. On the left, the maps of detections (% of events affecting each electrode) are depicted; on the right the corresponding contrasts between areas for the Extent of propagation in the area are shown.

