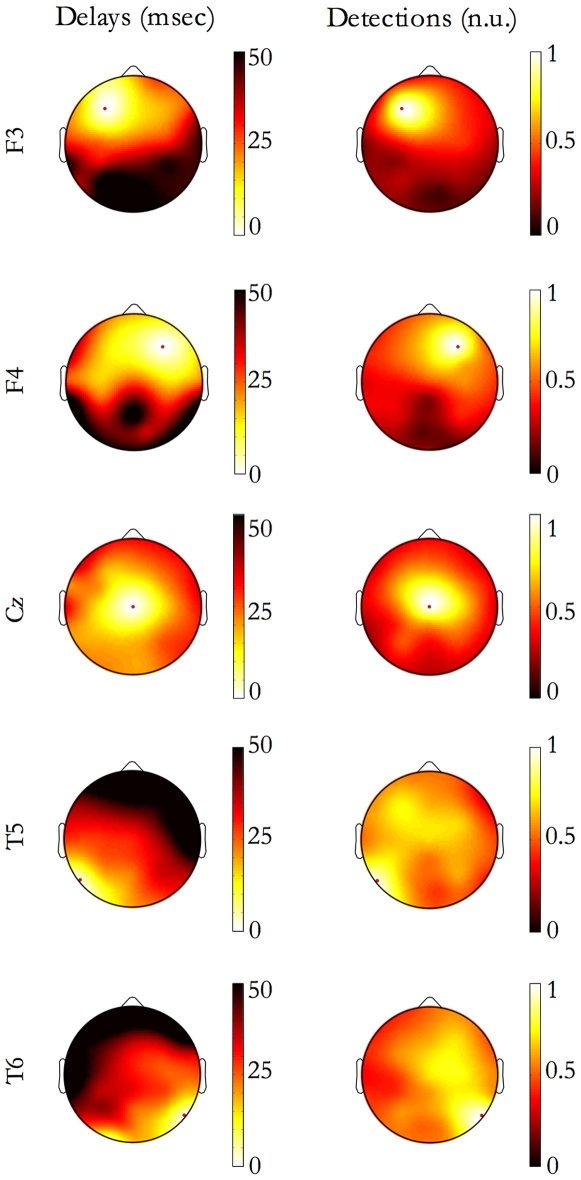
Figure 8. Continuity of event propagation.
For events originating in 5 exemplary origin sites (F3, F4, Cz, T5, T6), panels depict the grand-average maps of delays (left column) and the grand-average maps of detections. The number of detections at each electrode site was normalized to the number of events originating in the red-dot marked site (normalized units, n.u.). The hemispheric cortical separation does not seem to influence the radial propagation of SSO events.

