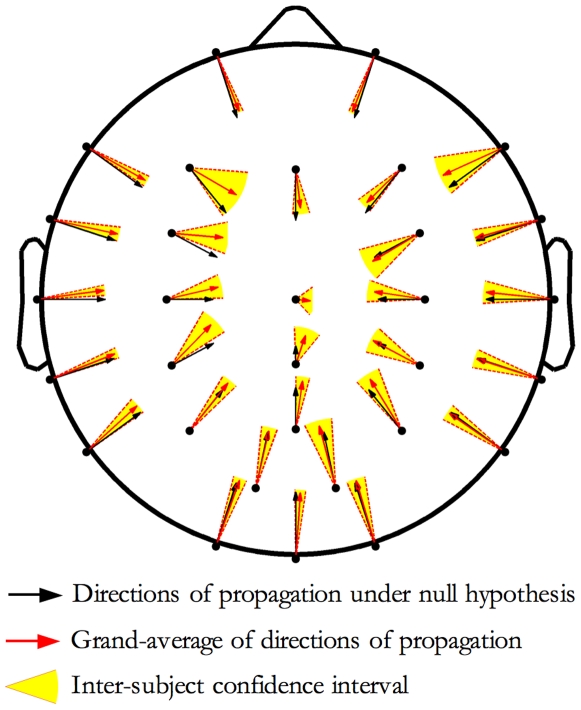
Figure 9. Directions of propagation.
For each origin site, the black vector indicates the null hypothesis direction (isotropic radial propagation), while the red one indicates the estimated grand-mean direction and the yellow circular sector depicts the variability (95% confidence interval) between individuals. Data indicate a systematic tendency to drift toward frontal areas.

