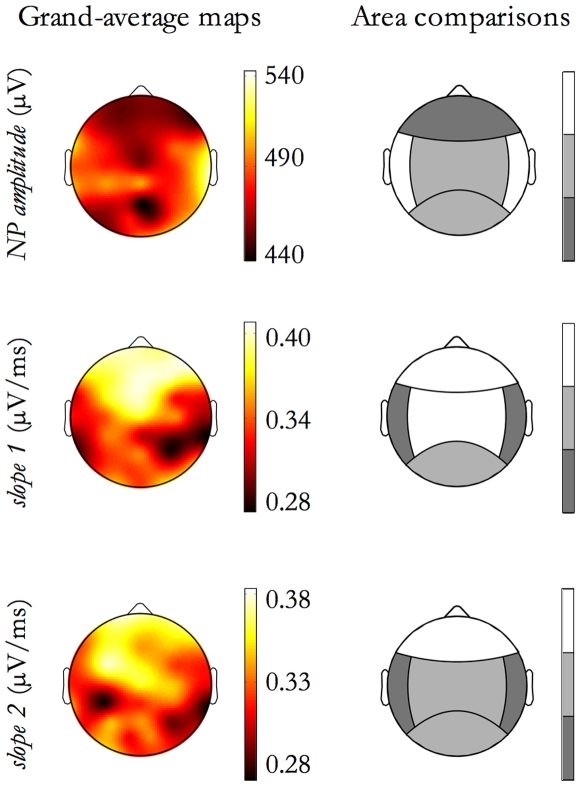
Figure 10. Morphological features as a function of Origin Location.
For features exhibiting an Origin Location effect, as reported in Table 2, contrasts between Origin Location areas is shown. Each row corresponds to a feature. On the left column, the feature grand-average map is depicted. Since maps correspond to the Origin Location effect, events originating from each origin site (electrode) have been selected and the grand-mean, for each electrode, has been derived. On the right column the contrast results are graphically reported by a grayscale code. Each step in the grayscale indicates a significant difference (p<0.01) between contiguous tones. The adopted grayscale is ordinal, namely lighter tones correspond to higher relative values for the feature.

