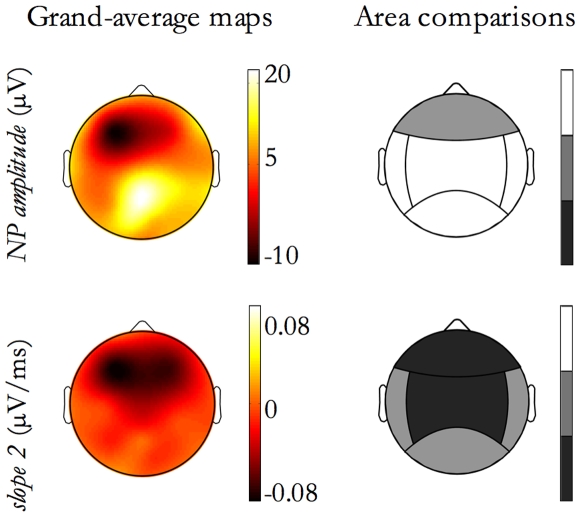
Figure 12. Morphological features as a function of Sleep Stage.
For features exhibiting a significant interaction between Detection Location and Sleep Stage, as reported in Table 3, the figure shows, for each area, comparisons between sleep stages. In the figure, each row corresponds to a feature. On the left column, grand-average maps derived subtracting Sleep Stage 2 values from SWS values are shown. On the right column, a grayscale code indicates for each detection area if feature values are significant greater during SWS (white), or during sleep stage 2 (black) while grey indicates no difference between stages.

