
Figure 7.
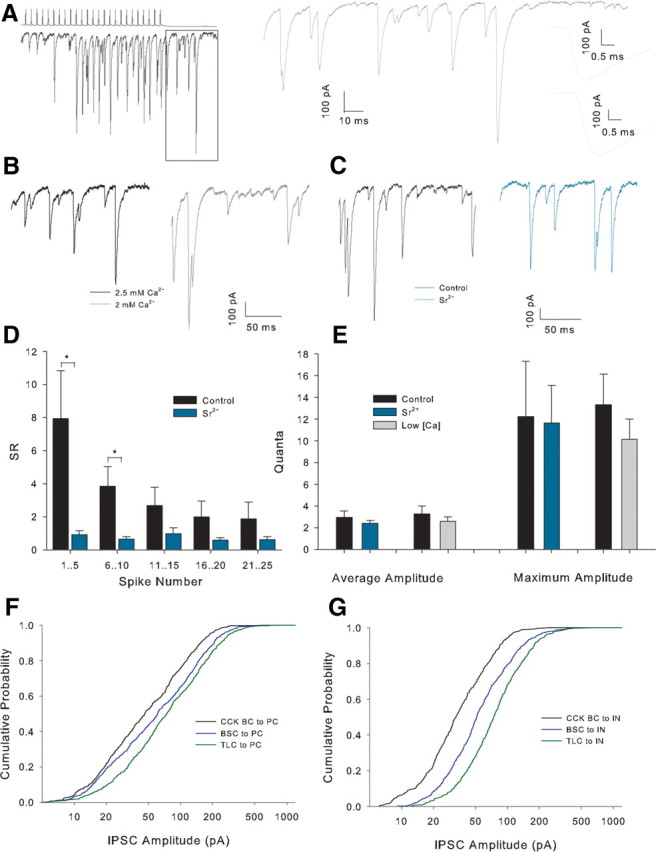
Large amplitude posttrain events persist in Sr2+ or low Ca2+. A, Example recording showing large amplitude, apparently quantal, events. Trace on the right shows the boxed region on an expanded scale with the two largest amplitude events inset on far right with scale further expanded. B, Example posttrain traces in 2.5 mm Ca2+ (black) and Sr2+ (gray) in the same recording. C, Example posttrain traces in control (black) and Sr2+ (turquoise) in the same recording. D, Histogram of SR versus grouped spikes for all recordings in control and a solution comprising 4 mm Sr2+, 0 mm Ca2+, and 1 mm EGTA (Sr2+), n = 8 (CA1 n = 5, CA3 n = 3). *p < 0.05. E, Posttrain event amplitude histogram in control conditions low [Ca2+]E and Sr2+. Maximum amplitude is the mean value of the largest individual posttrain event in 10 sweeps for each condition. F, Cumulative frequency amplitude distribution for posttrain asynchronous events in interneuron to PC pairs. CCK n = 9 pairs (all CA1), BSC n = 9 (all CA1), TLC n = 9 (all CA1); p < 0.001 for comparisons between all pairs cell types, Kolmogorov–Smirnov test. G, Cumulative frequency amplitude distribution for posttrain asynchronous events in interneuron to interneuron pairs categorized by presynaptic cell type. CCK BC n = 6 (CA1 n = 5, CA3 n = 1), BSC n = 9 (CA1 n = 8, CA3 n = 1), TLC n = 7 (CA1 n = 5, CA3 n = 2); p < 0.001 for comparisons between all pairs of cell types.