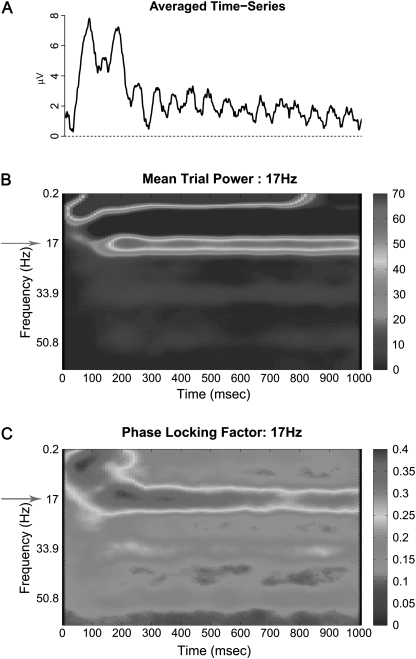
Fig. 3.
Averaged Visual Steady State Response Elicited by Flickering White-Black Visual Stimuli, Presented at a Flicker Rate of 17 Hz and Presented for 1000 ms in 46 Healthy Participants. Panel A represents the averaged time series waveform. Panel B represents the time-frequency spectrogram of mean power. Panel C represents the time-frequency spectrogram of phase locking factor. All axes labels are the same as corresponding analyses in figure 1.

