Fig. 2.
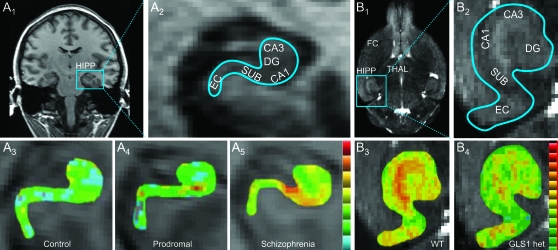
CBV Imaging of the Hippocampus in Clinical Subjects and Mice. (A) In clinical subjects (A1), high-resolution T1-weighted images in a coronal section can resolve hippocampal subregions (A2). Individual CBV maps of the hippocampal formation are shown from a healthy control (A3), a prodromal subject (A4), and a schizophrenia subject (A5). Maps are color coded such that warmer colors reflect higher CBV values. CBV increased from the control to the high-risk subject in CA1 and to the schizophrenia subject in CA1 and SUB. (B) In mouse, high-resolution images in a horizontal section (B1) resolve hippocampal subregions (B2). In WT mice, regional CBV is fairly uniform across hippocampal subregions (B3), while in GLS1 het mice, CA1 and SUB show a selective reduction (B4). A similar comparison in FC revealed no difference between WT and GLS1 het mice (images not shown). CBV, cerebral blood volume, HIPP, hippocampus; CA1 and CA3, hippocampal subregions; SUB, subiculum; DG, dentate gyrus; THAL, thalamus; EC, entorhinal cortex; FC, frontal cortex; WT, wild-type mice; GLS1 het, GLS1 heterozygous mice. Source: Panel A is redrawn from Schobel et al,37 with permission of the American Medical Association (Archives of General Psychiatry). Copyright 2009 American Medical Association. All rights reserved. Panel B is redrawn from Gaisler-Salomon et al38 with permission of the authors.

