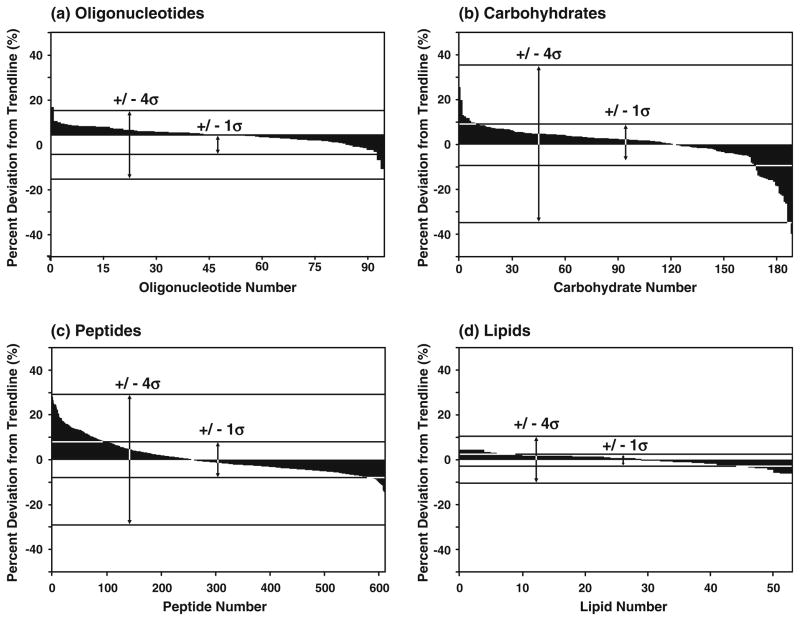
Fig. 2.
Residual plots of each molecular class for the data shown in Fig. 1a and about the logarithmic regressions provided in Fig. 1b. These plots illustrate the percent relative deviation (±) for all of the species reported. The abscissa axis is ordered by descending values of percent relative deviation. The calculated values of σ indicated in each of the plots are a 3.70, b 8.81, c 7.33, and d 2.64, respectively

