
Fig. 4.
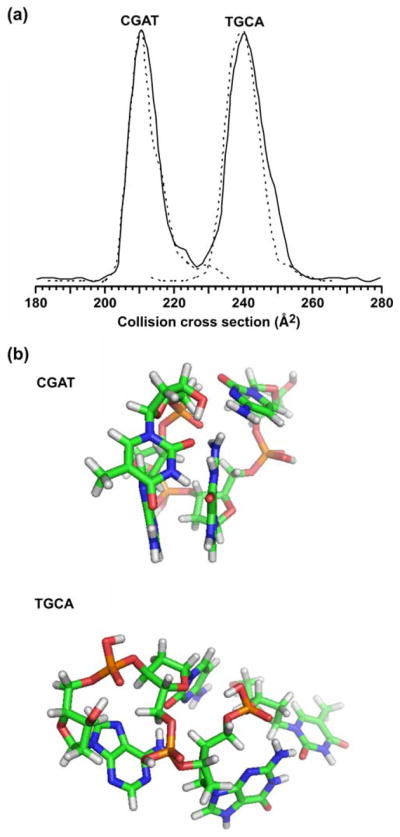
a A plot of the collision cross-section profile obtained in the separation of a mixture of two isobaric tetranucleotide species, CGAT and TGCA, respectively ([M+H]+=1,174.3). The solid line corresponds to a mixture of the two components. Dashed lines correspond to collision cross-section profiles obtained for each ssDNA species analyzed separately with signal intensity normalized to the height of the major feature in the profile for the mixture. b Molecular dynamics simulations for each of the two ssDNA species. For each species, ca. 21,000 structures were obtained that resulted in 666 and 1,405 low-energy structures that correspond to within ±2.5 Å2 of the measured collision cross section for CGAT and TGCA, respectively. Following an RMS analysis of these low-energy structures, the most representative structure is shown