Fig. 1.
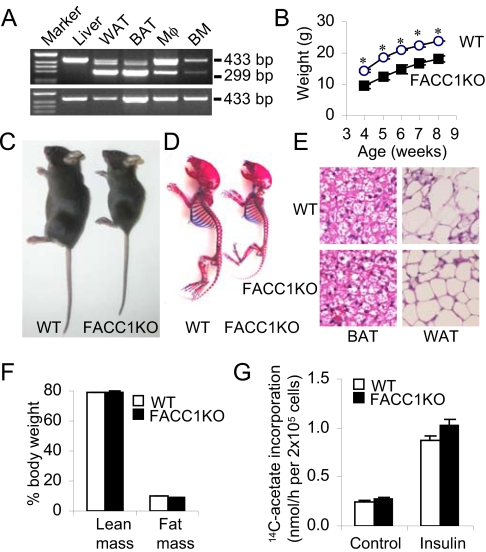
Skeletal and adipocyte development. (A) RT-PCR analysis of total RNA from FACC1KO mice and WT mice using primers 21f/24r. (Top gel lanes) Marker, 1 kb DNA ladder; liver; WAT, white adipose tissue; BAT, interscapular brown adipose tissue; Mφ, peritoneal macrophage; BM, bone marrow. Product (433-bp) represents the WT ACC1 gene. Product (299-bp) in mutant tissues—WAT, BAT, Mφ, and BM—indicates the appropriate deletion of exon 22 in the ACC1 gene; this product was absent in the liver. Bottom gel shows the absence of the 229-bp band in the corresponding WT mouse tissues. (B) A typical growth curve for male mice (n = 5). *, P < 0.005. (C) Photographs of representative 4-week-old male WT and FACC1KO mice. (D) Skeleton of 7-day-old male mice from the same litter. The skeletons were stained with alcian blue for cartilage and with alizarin red for calcified tissues. (E) BAT and WAT from 4-week-old male WT and its FACC1KO littermate, were stained with hematoxylin and eosin (H&E). The original magnification, 160×. (F) Lean mass and fat mass in 7-week-old male mice (n = 5) using the dual-energy X-ray absorptiometry methods. Percentage of body weight is presented. (G) Lipogenesis in primary adipocytes from 3-month-old WT and FACC1KO mice (n = 3) in the absence (Control) or presence of 100 nM insulin.

