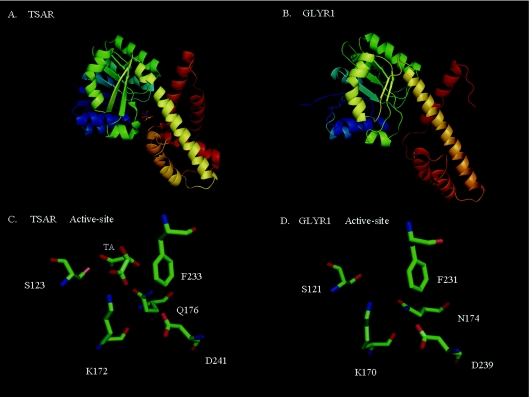
Figure 1. Molecular models of HIBADH family members.
(A) Crystal structure of TSAR (tartronic semialdehyde reductase) and its substrate analogue tartaric acid (TA) (PDB entry: 1VPD). (B) Predicted structure of GLYR1 generated by the fold-recognition server PHYRE (http://www.sbg.bio.ic.ac.uk/phyre/) using TSAR as a template. (C and D) Overlapping positions and identities of the predicted active-site residues for TSAR and GLYR1 respectively. Red, blue and green indicate negative, positive and hydrophobic regions of the residues.

