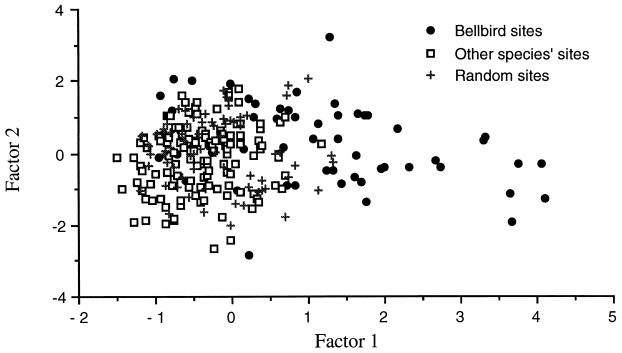
Figure 2.
Plot of all seed locations as functions of the first two axes of a principal component analysis of the correlation matrix (sas proc factor; ref. 30) of habitat variables. The first two factors explained 48% of total variance. The first factor is characterized most by high loadings of canopy cover (−0.86), number of stems (0.72), distance to nearest woody stem (0.65), and distance to parent (0.64). The second factor was characterized most by leaf litter (0.67). Note that seeds dispersed by bellbirds extend into regions farther from the parent trees and with more open canopy (i.e., higher loadings on factor 1) than seeds dispersed by the other four species. The loadings for factor 1 are significantly different among the random sites, bellbird sites, and other species’ sites (ANOVA: F = 71.6, df = 2, 252; P < 0.0001). The bellbird sites differ from random sites and from other species’ sites (post-hoc Fisher’s Protected LSD tests P values < 0.0001), but the random sites do not differ from the other species’ sites (P = 0.12).

