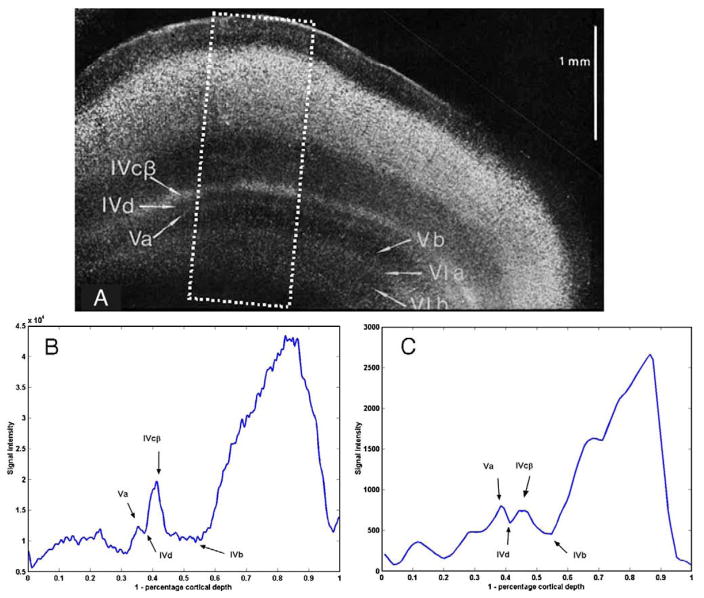
Fig. 9.
(A) An inverted light microscope image (Fig. 5, Plate 2 from Braak, 1976) of an 800 micron-thick slab of Astrablau-stained human visual cortex. (B) Average signal intensity along 120 profiles perpendicular to the cortical surface were calculated in the dotted rectangular region shown in (A). Arrows have been added to label the peaks and troughs corresponding to the documented lamina (layers IVb, IVcβ, IVd, and Va) in (A). (C) Fig. 8E is repeated here for comparison: Average of signal intensity along 12 profiles perpendicular to the cortical surface calculated for the rectangular area shown in Fig. 8B.

