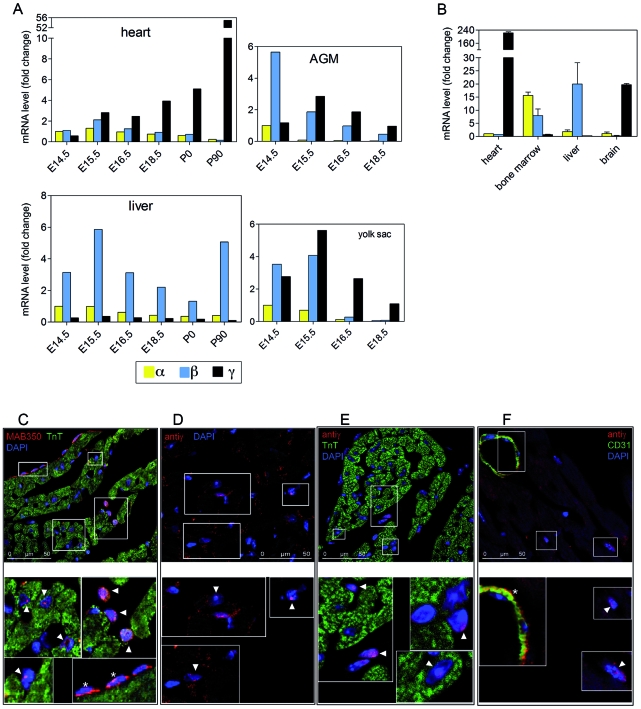
Figure 1. Isoform γ is the predominant Sdf-1 isoform expressed in the postnatal mouse heart.
(A) mRNA expression of the main Sdf-1 isoforms during late embryonic development and postnatally. Expression levels of Sdf-1α, Sdf-1β and Sdf-1γ were measured by quantitative real-time PCR on total RNA extracted from the indicated tissues at the indicated times. For each tissue, mRNA amounts were normalized to Sdf-1α expression at E14.5 ( = 1). AGM: aorta–gonad–mesonephros (B) Comparison of Sdf-1 isoform mRNA expression in adult (P90) tissues (qRT-PCR). RNA amounts in each tissue were normalized to Sdf-1α expression ( = 1). For embryo samples, RNA was pooled from at least five littermates; for postnatal stages, samples from five age-matched individuals at P0 or P90 were pooled. Analysis at each stage was repeated three times, yielding similar results (n = 5). (C to F) Confocal immunofluorescence of cardiac expression of Sdf-1γ in adult mice (P90). Thin (5 µm) cryosections of three-month old mouse heart were stained for Sdf-1 (red) with anti-pan Sdf-1 antibody (MAB350; C) or specific anti Sdf-1γ antibody (anti-γ; D,E,F). Green staining shows immunofluorescence of troponin T alpha (C, E) or CD31 (F). Nuclei were stained with DAPI (blue). Lower panels show high-magnification images of the boxed areas in the upper panels. Nuclear staining with anti-Sdf-1 antibodies is indicated by arrowheads (non-endothelial cells) or asterisks (endothelial cells). Note the nucleolar staining with anti-Sdf-1 antibodies, seen as spots inside nuclei.

