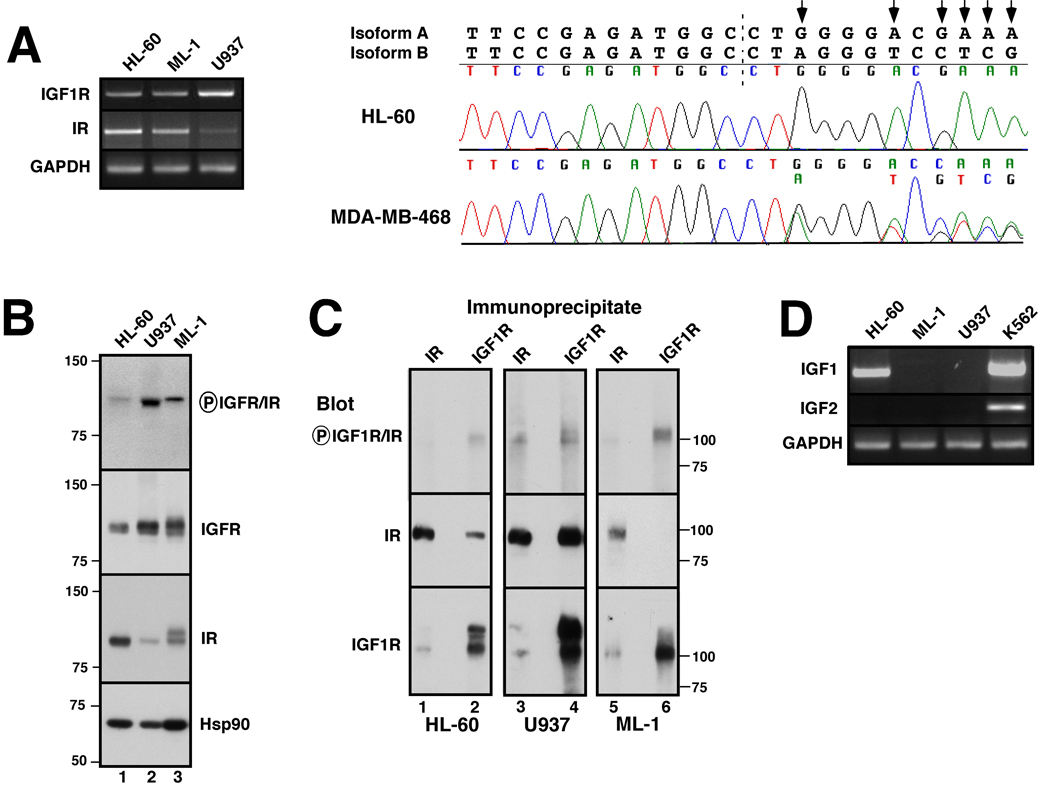
Figure 1. IGF-1R, IR, IGF1 and IGF2 expression in AML cell lines.
A, cDNA was amplified using primers specific for the β-chains of IGF-1R and IR as well as IRS-1, IRS-2 and, as a control, GAPDH. PCR products photographed under ultraviolet illumination (left panel) and sequenced to confirm their identities. Right panel, chromatograms obtained when IR cDNAs from HL-60 (upper) and MDA-MB-468 cells (lower) were sequenced across the splice junction (dashed line) between exons 12 and 11. Predicted sequences of isoforms A and B are shown above chromatograms. Arrows indicate nucleotides unique to the A isoform. MDA-MB-468 breast cancer cells, which express approximately equal amounts of both isoforms, served as a positive control for detection of both isoforms when present. B, Whole cell lysates were subjected to SDS-PAGE followed by immunoblotting with antibodies that recognize the indicated antigens. Heat shock protein 90 (Hsp90) served as a loading control. Numbers at left and in subsequent figures indicate molecular weight markers in kDa. C, Lysates from 2.5 × 10⁷ log phase HL-60 (lanes 1, 2), U937 (lanes 3, 4), or ML-1 cells (lanes 5, 6) were prepared in the presence of protease and phosphatase inhibitors and subjected to immunoprecipitation with monoclonal anti-IR (lanes 1, 3, 5) or polyclonal anti-IGF1R antibodies (lanes 2, 4, 6) followed by SDS-PAGE and immunoblotting with reagents that recognize the indicated antigens. D, cDNA was amplified using primers specific for IGF-1 and IGF-2. K562 cells served as a positive control for IGF2 expression.

