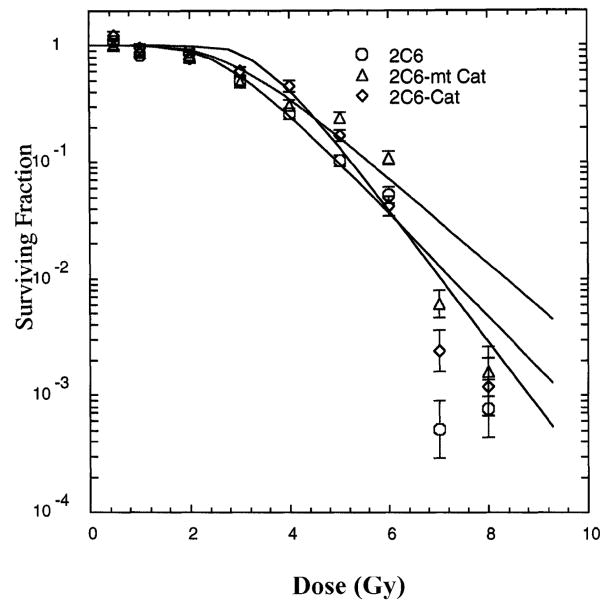
FIG. 2.
Survival curves for coexpression of mt-catalase and MnSOD. 2C6 cells overexpressing MnSOD were stably transfected with either the catalase or mitochondrial catalase transgene. Values are means ± SD from three experiments. Survival curve data were analyzed by the linear-quadratic model and the single-hit, multitarget model (shown on the figure). Fitting parameters are shown in Table 1.

