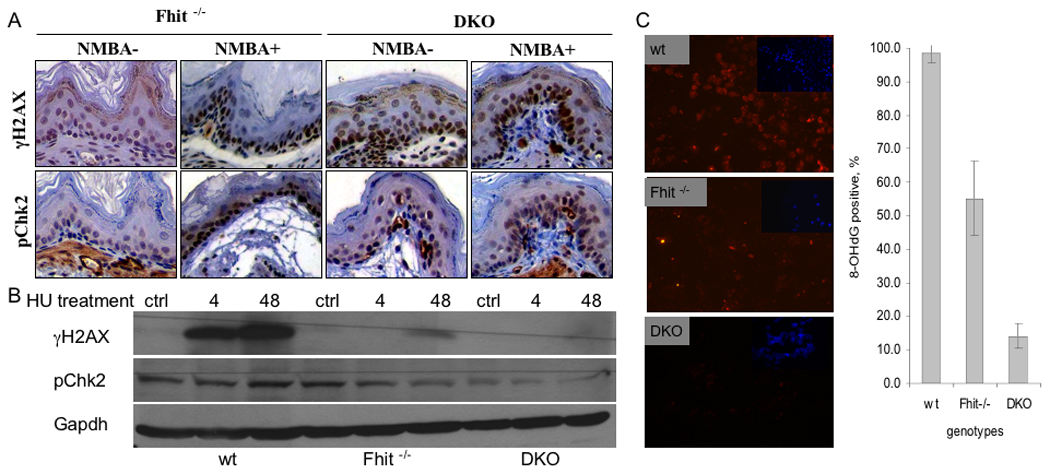
Figure 5. Expression of DNA damage response proteins in tissues of NMBA-treated KO mice and in KO-derived ‘normal’ kidney cells.

A. Examples of immunohistochemical staining for γH2AX and pChk2. The strongest expression of γH2AX was in NMBA treated Fhit−/− forestomach tissue. B Western blots of γH2AX and pChk2. Wt, Fhit−/− and DKO cells were treated with HU for 0 (ctrl), 4 or 48 h; γH2AX expression was the highest in wt cells followed by Fhit−/− cells. C. Left panel, cultured cells were treated with 8-OH-dG after exposure to 0.5 mM H2O2 for 5 h; DNA damage in wt, Fhit−/−, and DKO kidney cells was assessed by immunofluorescence detection of 8-OHdG (red); nuclei were counterstained with DAPI (blue, inset) (200x). Similar staining of cells that were untreated by H2O2 served as negative controls; fewer than 10% of cells showed 8-OHdG staining in the negative control cells (not shown). Right panel, bar graph illustrates frequency of 8-OHdG positive cells in the three cell strains; error bars indicate standard deviation of frequencies in three fields of stained cells (P<0.01 by Student t-test).
