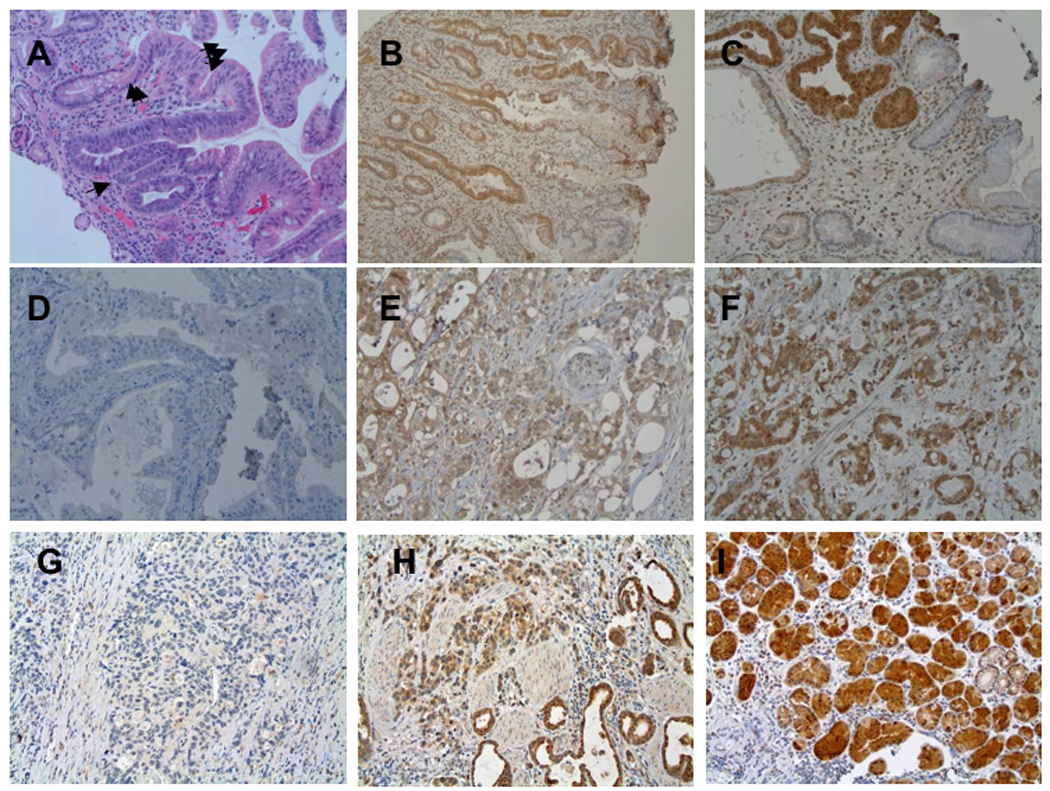
Figure 7. Assessment of Nit1 expression in human esophageal cancer tissues.

A. H&E of a section exhibiting Barrett glandular type tissue in esophagus, 1 arrow: basal compartment, 2 arrows: neck, 3 arrows: surface. B. Nit1 IHC staining of Barrett esophagi; slight Nit1 staining in basal compartment and negative in neck. C. Strong Nit1 staining in dysplasia and negative in Barrett esophagi without dysplasia. D-F. Nit1 staining of tumors, negative (D), slight (E), and strong (F). G–I: Fhit IHC staining. G: no Fhit staining (G); weak staining (H); strong staining (I).
