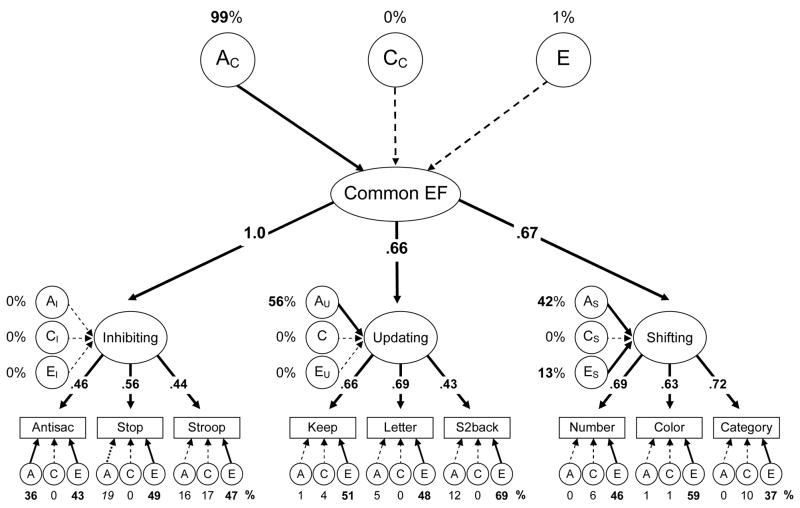
Figure 4.
Hierarchical multivariate executive function ACE model. Task names are abbreviated. Numbers above the top ACEs (AC, CC, and EC) are the percentages of the Common Executive (Common EF) variance due to genetic and environmental influences. The numbers occluding arrows are standardized factor loadings. Numbers next to latent variable executive functions’ ACEs (e.g., AI, AU, and AS) are their specific genetic and environmental variances independent of the Common EF factor. Numbers under the lower ACEs are estimates for the remaining nonexecutive variances in individual tasks. Boldface type and solid lines indicate p < .05. The italics type for stop-signal’s specific A variance indicates marginal significance (p = .052).

