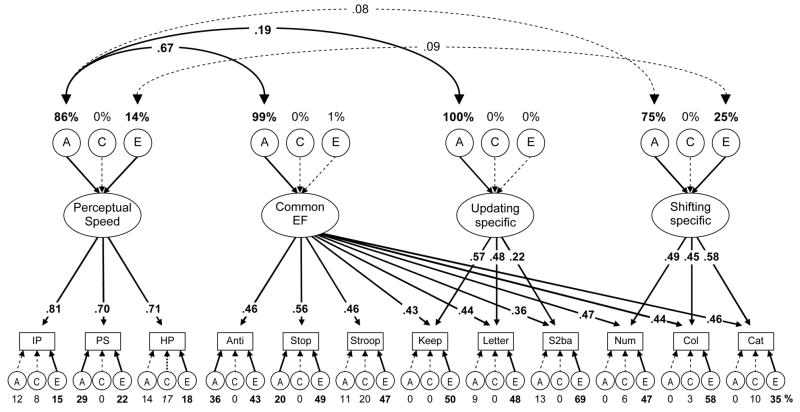
Figure 6.
Executive function ACE model with Perceptual Speed. Task names are abbreviated. Numbers above the ACEs for the latent variables are the percentages of those latent variables accounted for by genetic and environmental influences. Numbers occluding the double-headed arrows are correlation coefficients. Correlations for components with zero or near-zero variances were not estimated. The numbers occluding arrows are standardized factor loadings. Numbers under the lower ACEs are estimates for task-specific variances. Boldface type and solid lines indicate p < .05. The italics type for hidden patterns’s specific C variance indicates marginal significance (p = .055).

