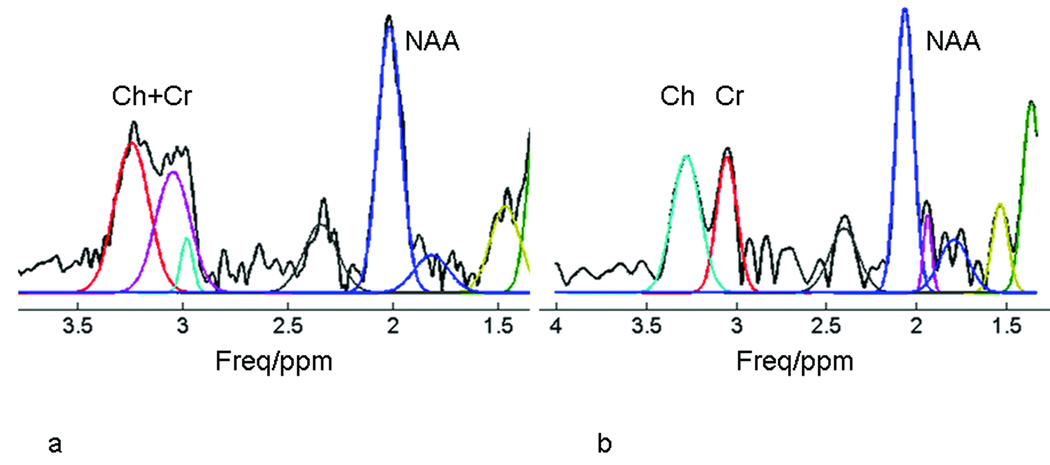
Figure 5.
Automatic spectral fitting before and after SPREAD. Because of poor spectral resolution and distorted lineshape, the peaks of creatine (Cr) and choline (Ch) were not accurately or correctly detected (note the two peaks near 3.0 ppm in the left panel). The discrepancy of the measured and fitted peaks for N-acetylaspartate (NAA) caused by lineshape distortion is obvious. Following the application of SPREAD (right), the Cr and Ch peaks are well resolved and the measured and fitted peaks agree well compared with spectra before the application of SPREAD (left).

