
Figure 2.
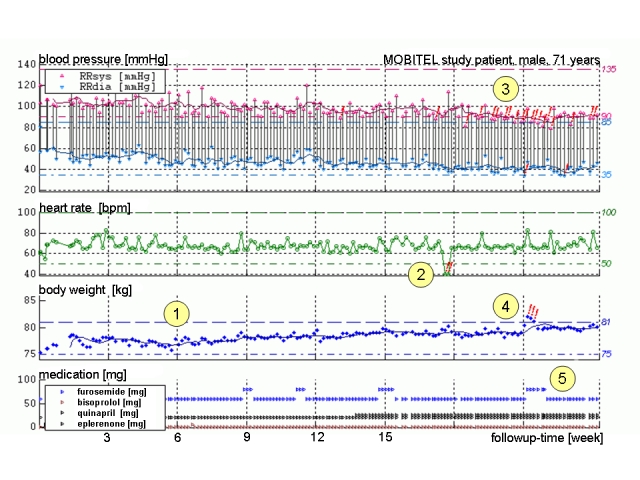
Trend chart of vital parameters of a typical patient (male, 71 years) over the 6-month study period: Each dot represents a transmitted value of (from top to bottom) systolic (red) and diastolic blood pressure (light blue), heart rate (green), body weight (blue), and heart failure medication (bottom panel, furosemide in blue); (1) After discharge from hospital, all transmitted values are stable, (2) Red exclamation marks indicate low heart rate, (3) Alarms due to decreased blood pressure herald a phase of instability, (4) Increase in body weight of more than 2 kg in 2 days, causing an alarm (red exclamation marks), (5) After telephone contact with the patient and confirmation of values, the daily dose of furosemide is temporarily increased and body weight returns to stable values within 3 days