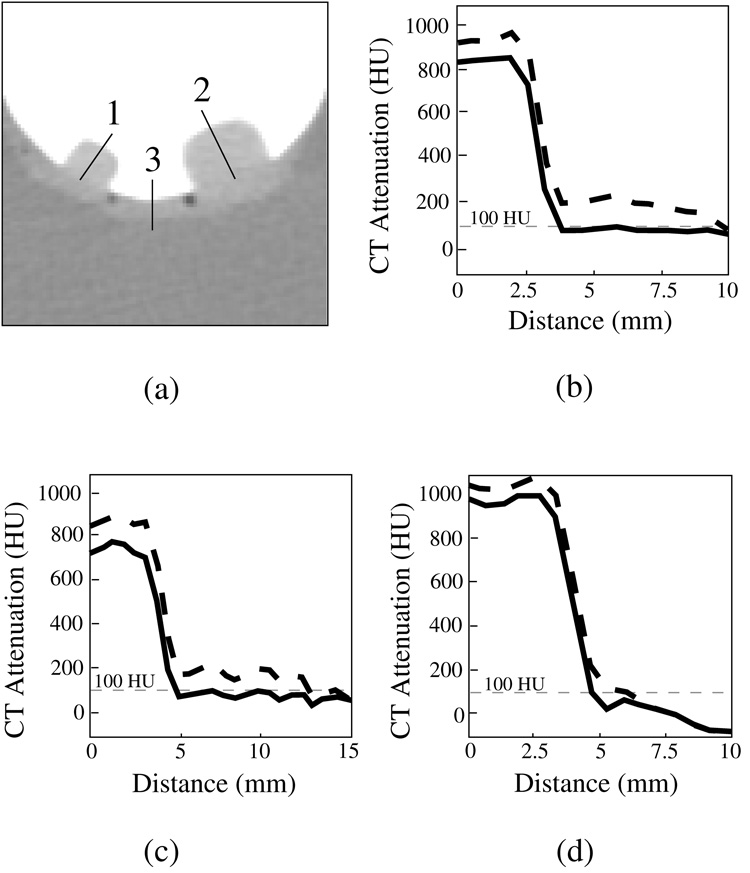
Fig. 9.
Profile plots of simulated 8-mm and 12-mm polyps and colonic wall submerged within a 900 HU tagging solution, before (dotted line) and after (solid line) the application of ADC. (a) The location of the lines along which the profiles were calculated. (b) Profile plot 1 (small polyp). (c) Profile plot 2 (large polyp). (d) Profile plot 3 (wall region). In each case, ADC has reduced the CT attenuation values within the simulated soft-tissue region to <100 HU.

