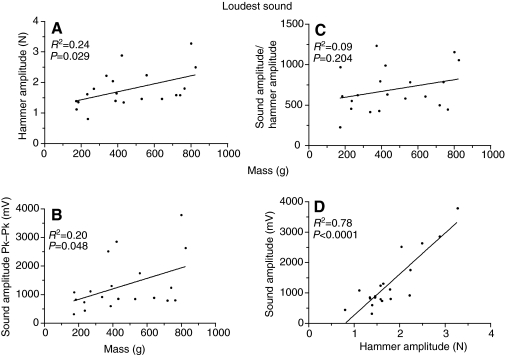
Fig. 15.
Comparison of hammer amplitude (A), sound amplitude (B, where Pk–Pk measures wave amplitude from the positive peak to the negative peak) and sound amplitude divided by hammer amplitude (linear units) (C) to fish mass for the hammer hit that evoked the most intense sound. (D) Relationship of sound amplitude to hammer amplitude (linear units) for the hits evoked by the most intense sound. The range in mV represents an increase of 22 dB.

