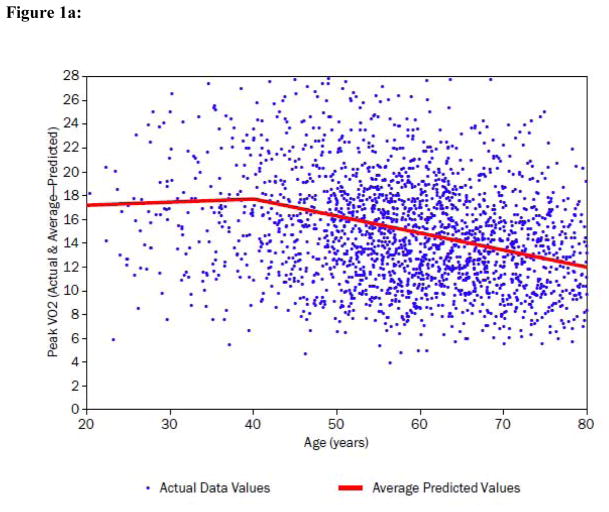
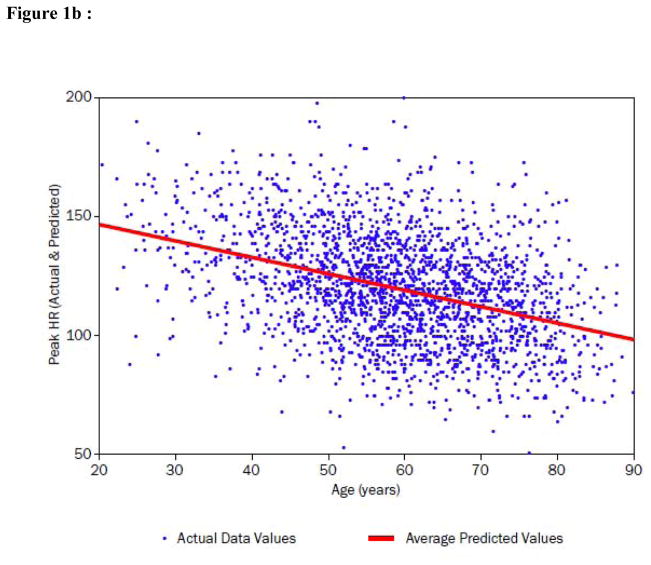
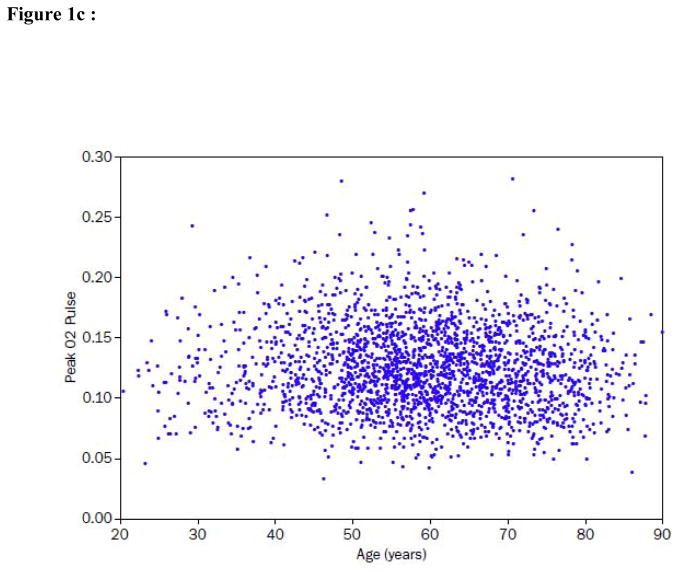
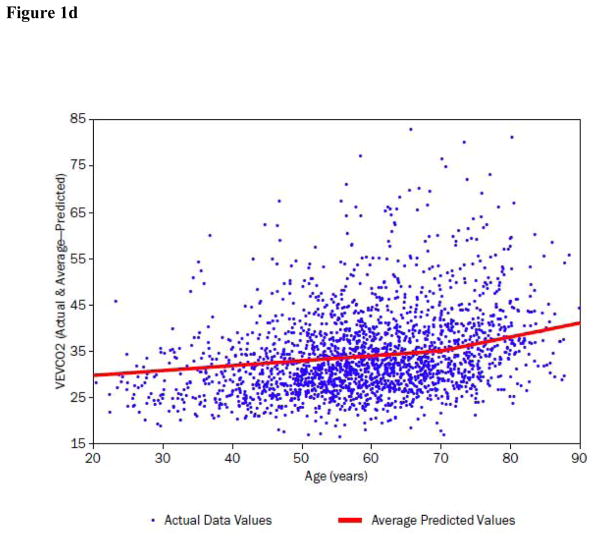
Figure 1. Peak VO2, peak heart rate (HR), O2 pulse and ventilatory efficiency (VE/VCO2) in relation to age in the HF-ACTION subject population.
In each plot individual data points represent actual data and regression lines of best fit are shown for some variables.
a) Peak VO2 (mL/kg/min) is displayed as a function of age. The regression line of best fit demonstrates a spline at approximately age 40 where the individual best fit regression lines have characteristics: <40 years: coefficient +0.03, partial r2 = 0.00, p=0.494; >40 years: coefficient −0.14, partial r2 = 0.12; p<0.0001 (Table 4).
b) Peak exercise HR (beats per minute) is displayed as a function of age. The best fit regression line is shown and displays an inverse relationship to age across the age distribution.
c) Peak O2 pulse (mL/kg/heart beat) is displayed as a function of age. There is a statistically significant but small correlation (r = −0.04, p = 0.03) between the two variables.
d) VE/VCO2 slope is displayed as a function of age. The regression line of best fit demonstrates a spline at approximately age 70 where the individual best fit regression lines have characteristics: <70 years: coefficient +0.11, partial r2 = 0.014, p<0.0001; >70 years: coefficient +0.30, partial r2 = 0.011; p<0.0001 (Table 5).


