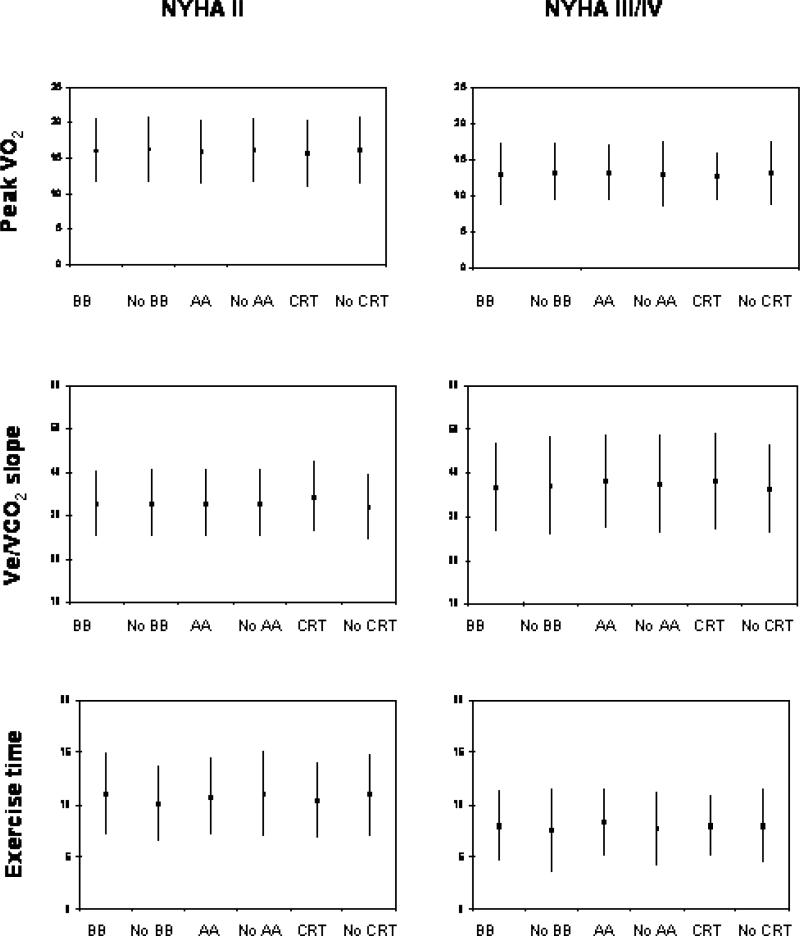
Figure 1.
Mean plus/minus standard deviation of patients peak VO2 measured in ml/kg/minute, Ve/VCO2 slope, and exercise duration in minutes for patients taking or not taking beta blockers (BB – n = 1668, No BB – n = 90), aldosterone antagonists (AA – n = 788, no AA – n = 970), or CRT therapy (CRT – n = 290, No CRT – n = 1468). Patients are split by their NYHA functional class.

