
Figure 1.
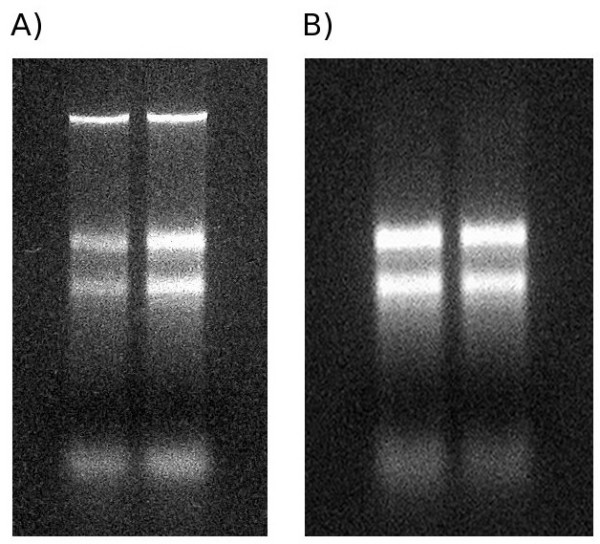
Image showing nucleotide size distribution from CTAB (panel A) and CTAB + RNeasy RNA isolations (panel B). Nucleotides have been resolved by denaturing gel electrophoresis and have been stained using ethidium bromide and viewed under a UV transilluminator. In both samples, clear rRNA bands can be seen, suggesting the integrity of the RNAs. In the CTAB gel, a band of high-molecular weight DNA can be seen, this is absent from the CTAB + RNeasy extractions.