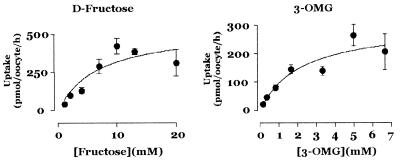
Figure 3.
Transport of fructose and 3-OMG by PfHT1. (Left) Initial uptake rates of d-fructose (representative of three independent experiments; see Table 2) and (Right) 3-OMG (representative of three independent experiments; see Table 1) are plotted against concentration of substrate (eight oocytes per concentration; mean ± SE). In this experiment, d-fructose Km = 6.8 mM; for 3-OMG Km = 0.9 mM.

