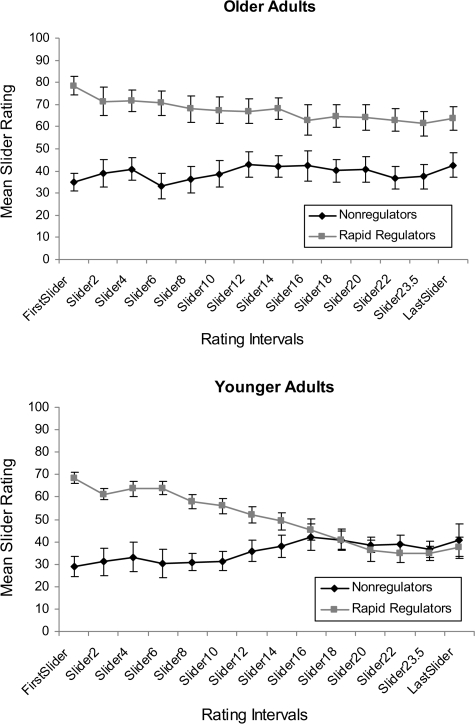
Figure 2.
Change in mood over approximately 24 min while performing a concurrent task, depicted separately by age group (older adults: top graph; young adults: bottom graph). Rapid regulators are represented by gray, nonregulators are represented by black. Mood ratings were captured before the concurrent task began (FirstSlider), every 2 min thereafter until the final presentation of the task (Slider23.5), and then immediately after completing the task (LastSlider).

