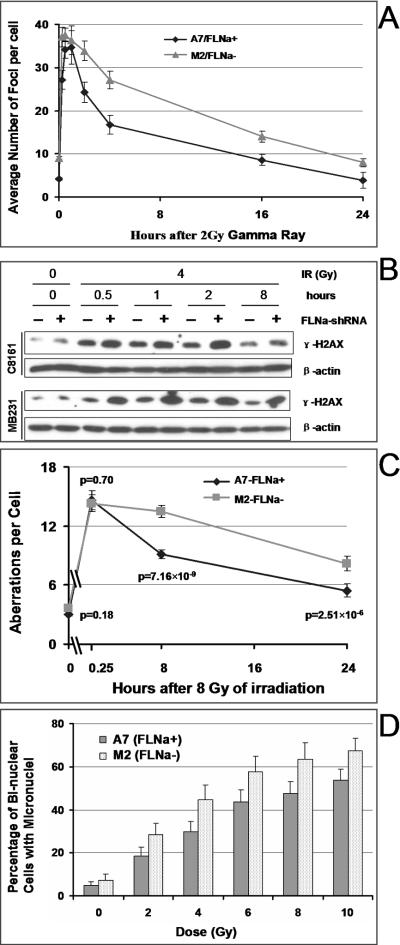
FIGURE 2.
Filamin-A deficiency impairs the DNA double strand break repair. Panel A shows the numbers of γH2AX foci per cell in A7 and M2 cells. At time points after the cells were treated with γ-radiation (panel A), cells were fixed and stained by immunoflurescent techniques with an anti-γH2AX antibody. The number of γH2AX foci was counted in >400 cells per time point in each experiment. Data shown are averages and standard errors of three experiments. Panel B shows the total γH2AX protein level measured by anti-γH2AX western blot at time points after irradiation (4 Gy) in C8161 and MB231 cells. The dose and times after irradiation are shown on the top of the panel. “FLNa-shRNA” indicates the whether the cells express filamin-A-specific shRNA. Beta-actin was used as a loading control. Panel C shows the total number of unstable chromosome aberrations per metaphase cell in A7 and M2. At 15 min, 8 hours, and 24 hours after 8 Gy of irradiation, mitotic chromosome spreads were prepared, and chromosome aberrations were scored from 40 independent metaphase cells as described in Materials and Methods. Data shown are averages ± SE (Standard Error). The Chi-Square Test was used to calculate the p-values, which are shown in the figure. Panel D shows the rate of micronuclear formations in A7 and M2 cells. Cytokinesis was blocked by treatment with cytochalasin B to form binuclear cells 24 h after γ-irradiation. Micronuclei in binuclear cells were visualized by Giemsa staining and scored under light microscopy. About 1000 binuclear cells in each experiment were analyzed and the data are averages of 5–6 independent experiments. Shown is the percentage of binuclear cells that have at least one micronucleus. The p-values indicate statistic significance based on t-tests.

