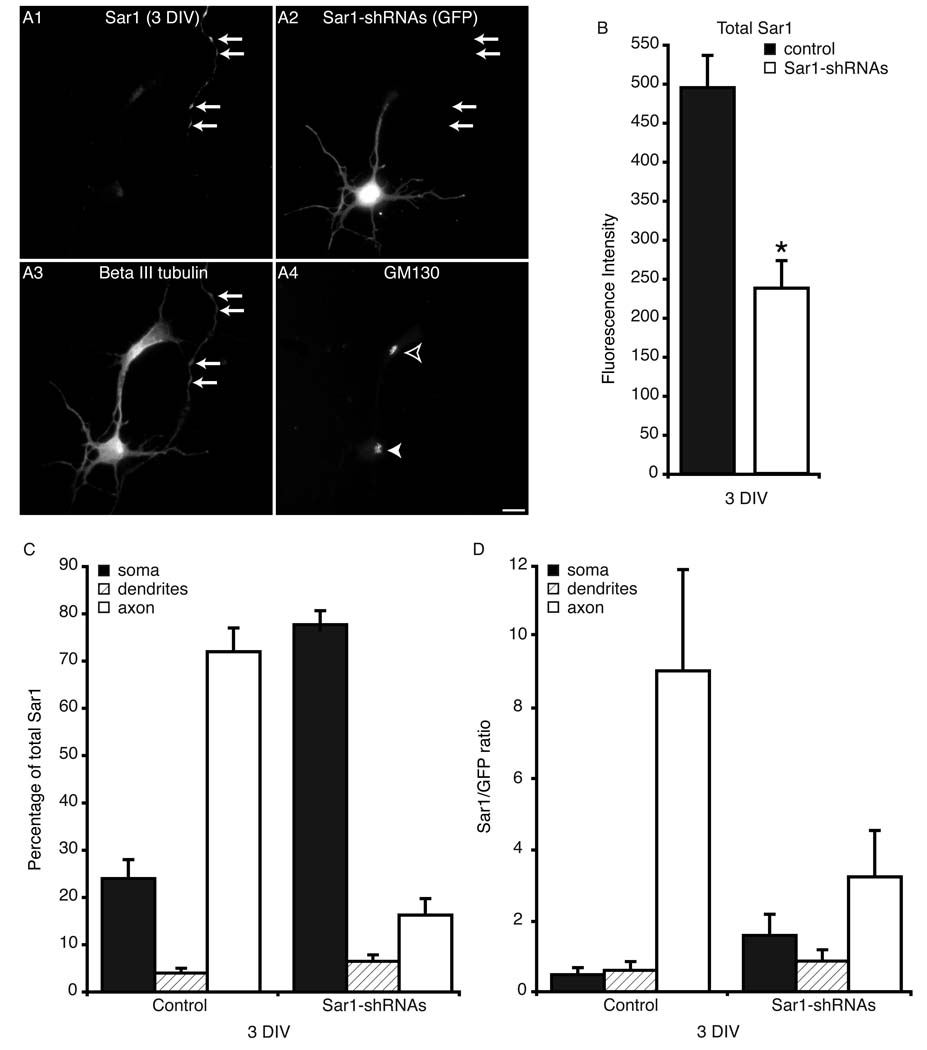
Figure 5. Quantitative analysis of Sar1 levels in 3 DIV neurons.
(A) Primary rat hippocampal neurons were transfected with Sar1-shRNAs prior to plating and labeled with antibodies to Sar1, beta III tubulin, and GM130 at 3 DIV. (B–C) Sar1 levels in neurons transfected with GFP (control) or Sar1-shRNAs were quantified by immunofluorescence microscopy. Values equal mean ± SEM. The asterisk in B designates a significant difference between the two conditions. (B–D) See main text for statistical analysis of the data. The arrows in A1 point to Sar1 staining in an axon coming from a neuron that is outside the field of view. The arrows in A2 & A3 point to the same region as those in A1. The filled arrowhead in A4 points to the Golgi of the neuron in the field that has been transfected with the Sar1-shRNAs constructs, while the open arrowhead points to that of an untransfected neighboring cell. The bar equals 10 µm.

