Fig. 3.

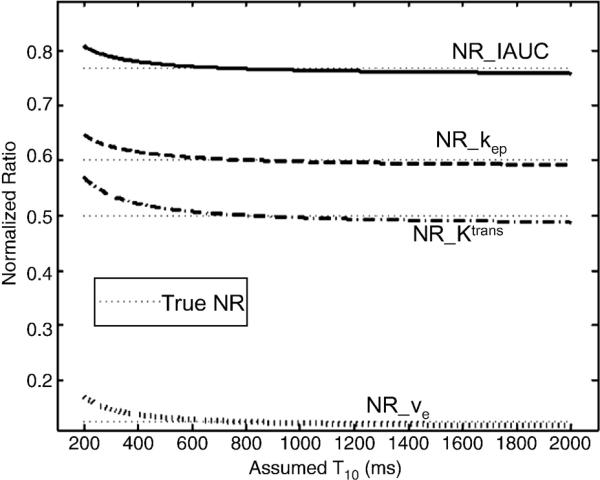
Plots of the normalized ratios of IAUC, kep, Ktrans and ve. True NRs are 0.77, 0.6, 0.5 and 0.125, respectively (dotted lines). The same true T10 (800 ms) was assumed for both pre- and post-treatment.

Plots of the normalized ratios of IAUC, kep, Ktrans and ve. True NRs are 0.77, 0.6, 0.5 and 0.125, respectively (dotted lines). The same true T10 (800 ms) was assumed for both pre- and post-treatment.