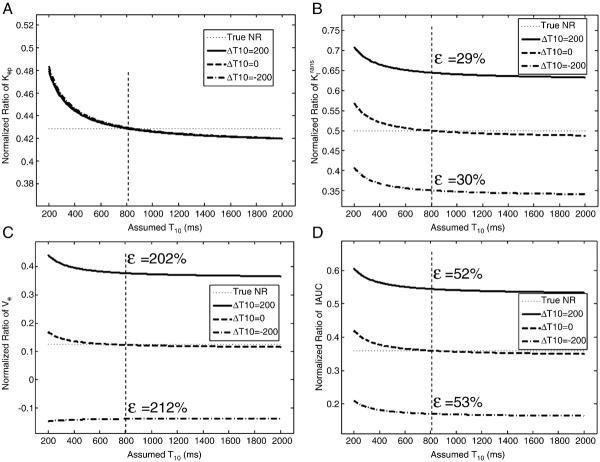
Fig. 5.
Effects of changes in baseline T10 following treatment. Plots of the normalized ratios of kep (a), Ktrans (b), ve (c) and IAUC (d) with different pre- and post-treatment baseline T10 values. True NRs are 0.0.429, 0.5, 0.125 and 0.36, respectively. A change in T10 between pre- and post-treatment is calculated as ΔT10=T10_pre-T10_post. A true T10 = 800 ms was assumed for pre-treatment. ε represents the percentage error at assumed constant T10 = 800 ms.

