
Fig. 6.
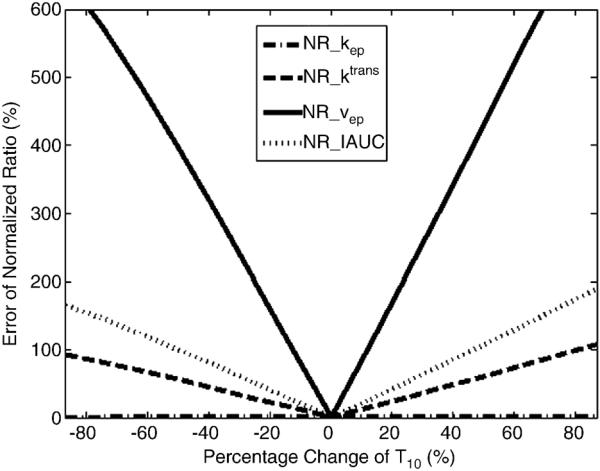
Plots of the error of normalized ratios vs. percentage change of T10. The true T10_pre is fixed to 800 ms. The percentage change of T10 is equal to (T10_pre-T10_post)/T10_pre.
Official websites use .gov
A
.gov website belongs to an official
government organization in the United States.
Secure .gov websites use HTTPS
A lock (
) or https:// means you've safely
connected to the .gov website. Share sensitive
information only on official, secure websites.
Plots of the error of normalized ratios vs. percentage change of T10. The true T10_pre is fixed to 800 ms. The percentage change of T10 is equal to (T10_pre-T10_post)/T10_pre.