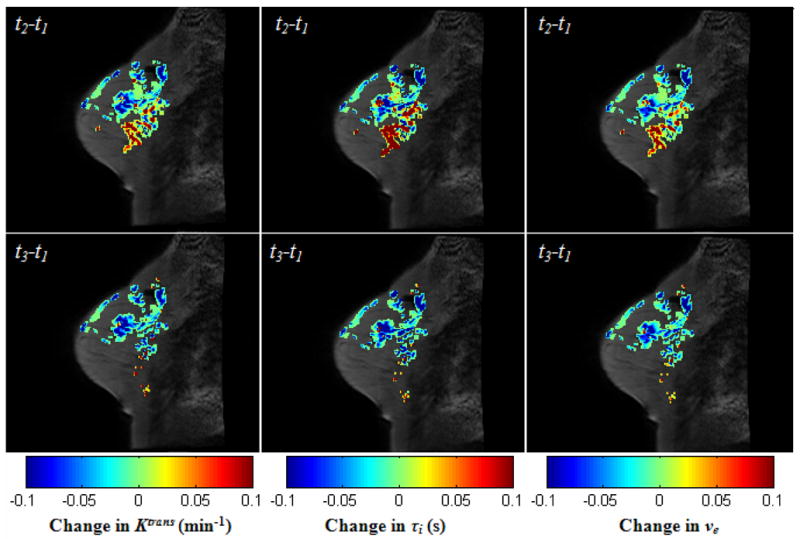
Figure 8.

The central slice with two kinds of difference images of the three parameters, Ktrans, τi, and ve, superimposed: the difference between the post-one cycle of chemotherapy and the pre-treatment (t2−t1), and the difference between the completion of treatment and pre-treatment (t3−t1). Note that all of three parameters are decreasing in most voxels, although there’s an increase in some other voxels after the first cycle of treatment. After the completion of chemotherapy, nearly all values of three parameters decrease.
