
Figure 4. Electron micrographs of kDNA networks and maxicircles from TbPIF2 overexpression cells.
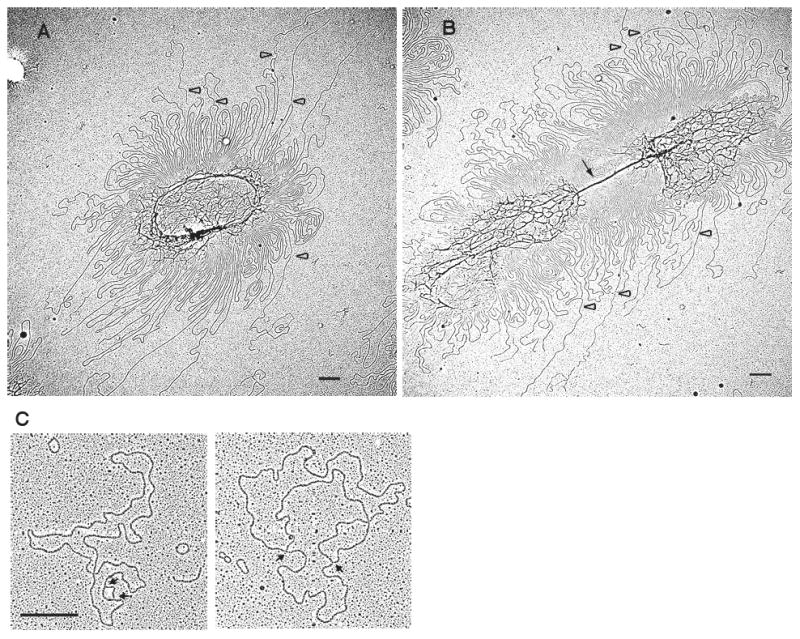
(A) and (B), kDNA isolated from TbPIF2 overexpression cells one day after induction. Black arrow, long dense connection between the two sister networks; empty arrowhead, maxicircle loops with one linear branch. Bar, 500 nm. (C), EM of θ-type replicating maxicircles. After in vivo trioxsalen cross-linking, kDNA was isolated, decatenated by topoisomerase IV and analyzed by EM. Arrows indicate branch points. Bar, 500 nm.